Here is an example of the data that can be collected
-
A set of 15 scans are taken for a selected area. (Full Analysis, Mineral Data Requirement)
-
Each scan takes approx. 20-30 seconds from start to finish, resulting in a full set of scans in under 8 min.
-
A set of 5 Scans can be performed, but will not provide Mineral Data.
-
A single scan can be done, .
-
All scan data can be exported as an Excel file for efficient data transfer to an agronomist for extra analysis.
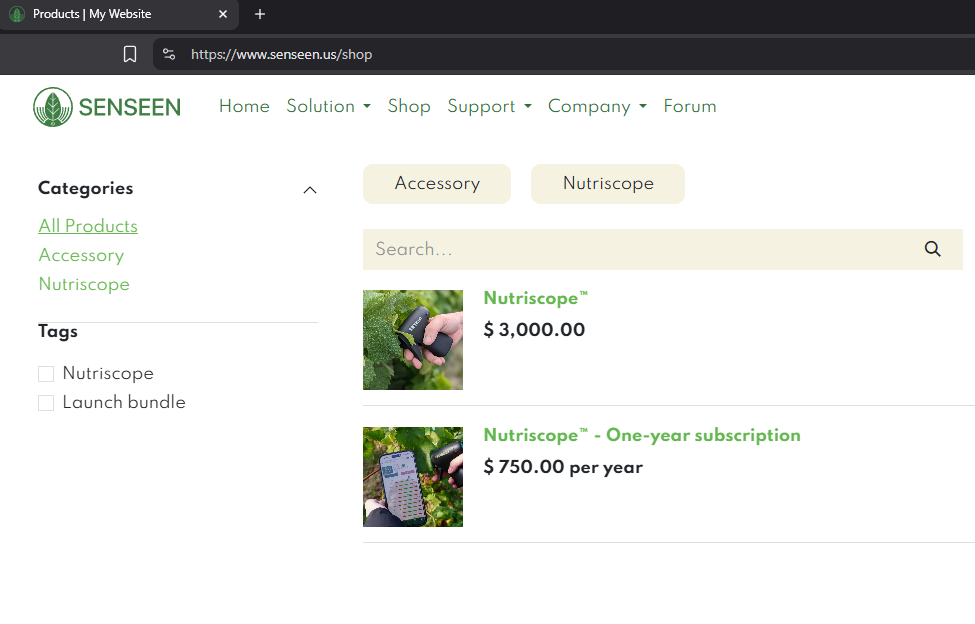
Price
Here's the kicker. A single unit runs 3k (USD)
A one year subscription runs 750 USD / Yr
However, there are instances where Senseen offers a discounted price.
This was offered during R-Soil 2025
- $1000 off the Sensor
- $250 off of the One year subscription
Data
Key Factors
-
Redox is measured in mV
-
Oxidation is the loss of electrons (energy)
-
Reduction is the gain of electrons (energy)
-
NO3- (Nitrates) would be an oxidative ion (- Charge)
-
NH4+ (Ammonium) would be a reduced ion (+ Charge)
-
More complex molecules (Amino Acids, Proteins, Enzymes, Humic Acid, Glucose) are reduced forms of molecules that result in a lower redox level.
-
In the plants, photosynthesis uses the light energy of photons to combine (reduce) carbon dioxide from the air with hydrogen taken from water. [1] This reaction produces glucose and releases oxygen. (Reducing the Carbon and Oxidizing the Air.)

Data Breakdown:
6.24.25
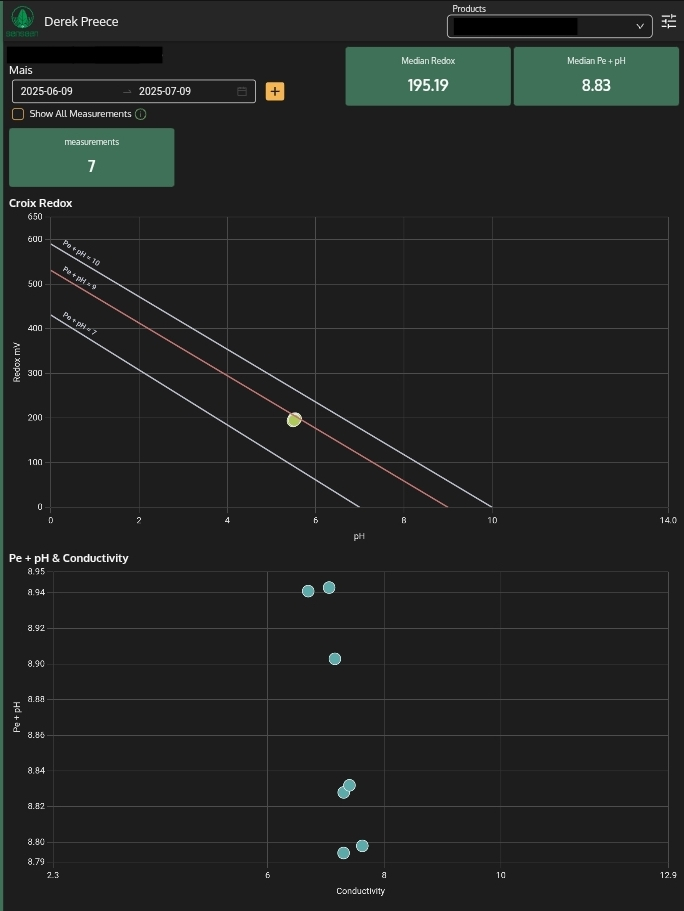
Some correlations can be observed over the days measured:
While High Temp and High humidity were recorded, notice the lower Pe + pH (Stress) levels.
Also note Redox values are more reduced.
6.29.25 - 6.30.25
As the temp and humidity climb;
Pe + pH is lower then starts to climb
Redox measurements start to increase in value (we are looking to lower the number overall)
Brix starts to climb
Chlorophyll production along with Brix Measurements.
-
These graphs are a good visualization of where plants are on a scale but you gain a better insight into what a crop has expressed over time.
-
More measurements will lead to a better understanding of what stressors a plant has experienced through the different growth cycles.
Mineral Analysis
- The benefit of capturing crop data overtime is the visualization and analysis of mineral uptake through the different key stages of plant growth and development. [2]

-
Temperature, Humidity, Pe + pH, pH, Redox, Brix Conductivity and Chlorophyll are all measurements that can be obtained with either 5 or 15 scans.
-
Pe + pH indicates the ability to gain or lose electrons. [3]


Field Observations
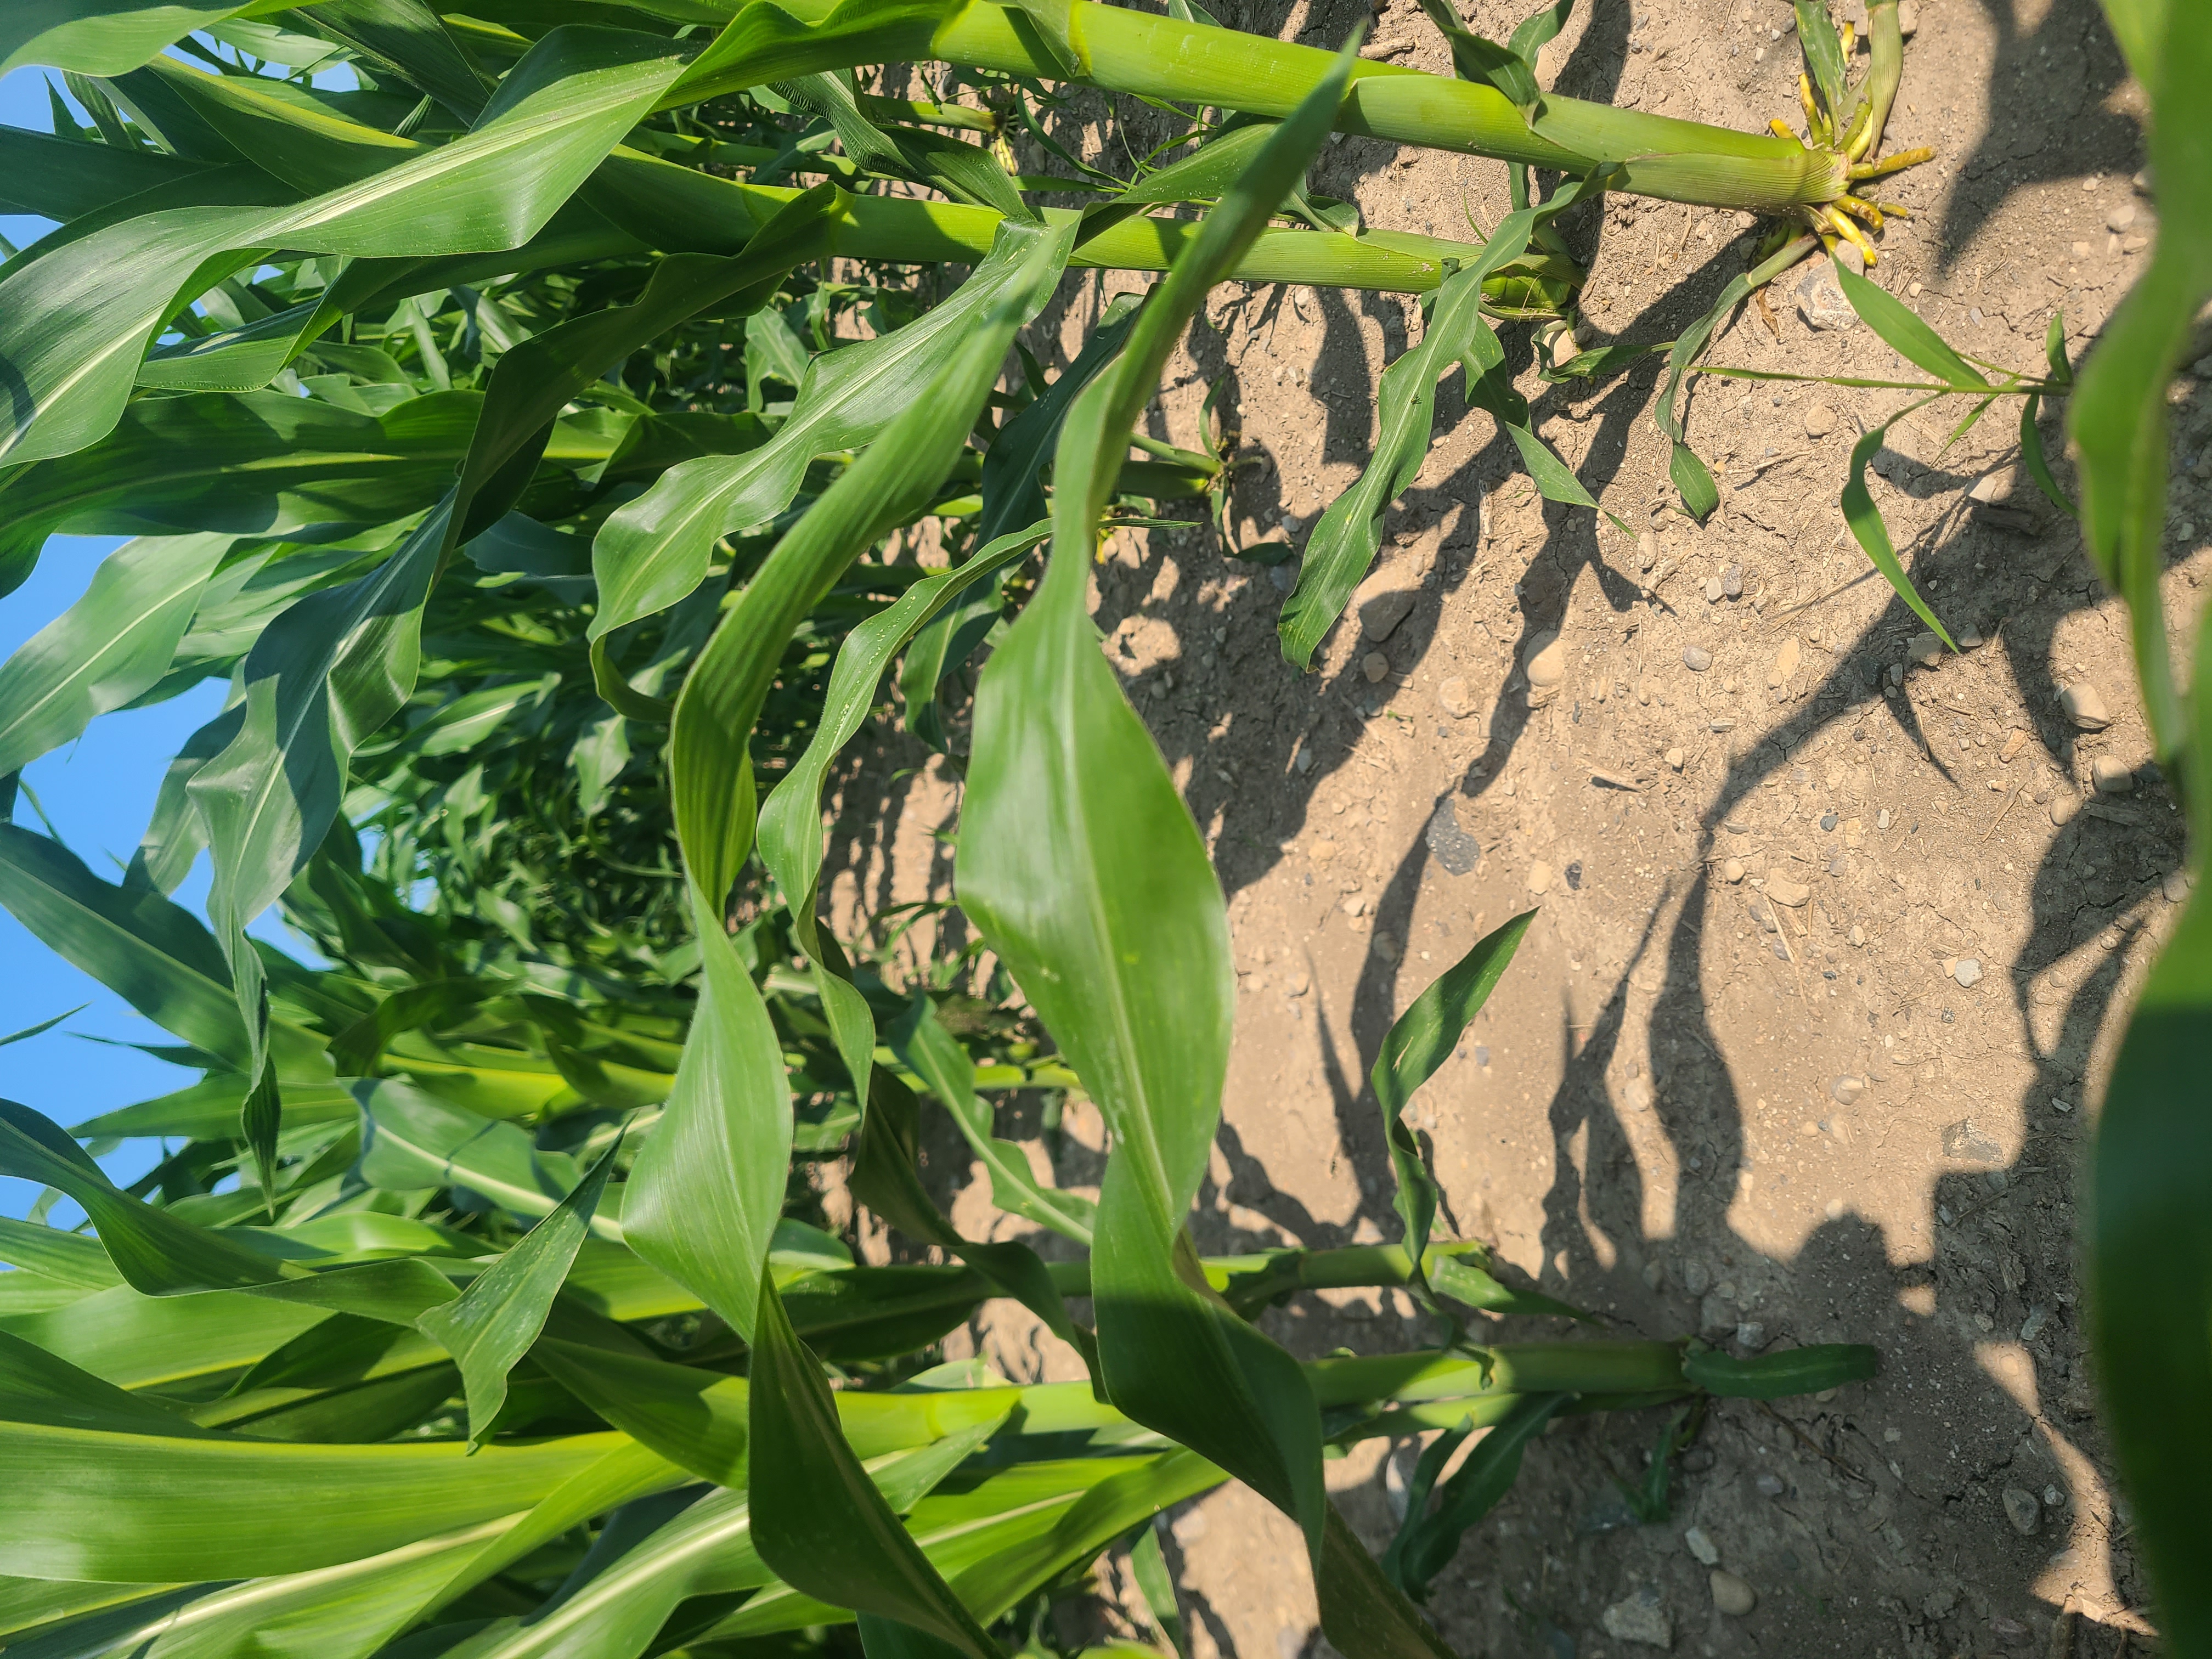
As observed in the photo, there is little no no vegetation / residue covering the bare soil between the corn plants.